|
The program DropDataAnalysisCalSysErr
analyzes the output of the program DropGenCalSysErr
discussed on the previous page. The program
is quite similar to DropDataAnalysis
from Chapter 10: Physics except
that it allows the user to enter a "calibration" constant
that will be subtracted from the position data. Also the program
displays the full polynominal fit to the y vs. time data.
The DropDataAnalysisCalSysErr
class mainly deals with the GUI and with reading in the data from
the file. It lets an instance of DropAnalyzerCalSysErr,
which is a subclass of DropAnalyzer
, do most of the actual analysis. This class fits the data points
and then plots the data and fitted polynominal line on a panel displayed
on the GUI. Before the fit, DropAnalyzerCalSysErr
subtract from the position data values the value given in the calibration
field on the user interface.
|
DropDataAnalysisCalSysErr
DropDataAnalysisCalSysErr
-
Developed from from the Chapter
9: Physics: Experiment Simulation with Analysis Module
and Chapter 10: Simulated
Data Generation and Analysis Demo, this program examines
the data produced by DropGenCalSysErr. It
allows the user to enter an "calibration" constant
to subtract from the position values. It also displays
the whole fit to the position vs time data.
The
drop down menu allows the user to select a file chooser
to find the data file. The first text field shows the
data file selected.
The
second text field allows the user to enter the calibration
value to subtract from the position data.
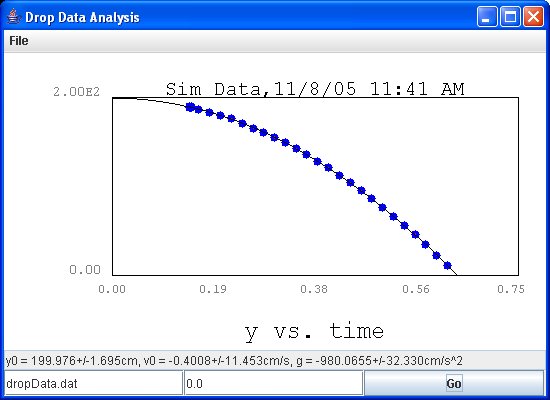
The
blue dots in the above plot are the position of the dropped
mass for each time step during the drop averaged over
the number of drops in the data file. Vertical red lines,
just barely visible in this plot, represent the error
on these y position averages. (The time step values are
considered exact.)
DropAnalyzerCalSysErr
- subclass of DropAnalyzer
that allows for subtraction of a calibration constant
from the position values. It also displays the whole polynominal
fit to the y vs t data.
+ Previous Classes:
Chapter
9: Physics: DropAnalyzer
Ch.
8: Physics:
Fit.java,
FitPoly.java,
DrawPoly.java
Ch.
6: Tech:
DrawPanel.java,
DrawPoints.java,
DrawFunction.java
Chapter
6: Tech: PlotPanel.java,
PlotFormat.java
|
import
javax.swing.*;
import java.awt.*;
import java.awt.event.*;
import java.io.*;
import java.util.*;
import java.text.*;
/**
* This program reads in data from a file created
by DropGenerator.
* For each drop event the data is sent to an instance
of DropAnalyzer.
* When all the data is read, a fit is made to
the average y vs t curve
* to determine the g parameter as before.
**/
public class DropDataAnalysisCalSysErr extends JFrame
implements
ActionListener
{
// Constants to identify type of data according
to the
// bits set.
final static int RUN_SIM =
0x1; // Simulation
final static int RUN_ADDCAL = 0x2; //
Include instrument constants
final static int RUN_RUNCAL = 0x4; //
Calibration run
final static int RUN_SYSERR = 0x8; //
Simulate systematic error
int fRunType = RUN_SIM; // Default to simulation
data.
// UI control variables
JMenuItem fMenuOpen;
JMenuItem fMenuSave;
JMenuItem fMenuClose;
JTextField fFileTextField; //
Input data file name
JTextField fCalPosTextField; // Calibration
constant user input
double fCalPosConstant = 0.0; // Calibration constant
DropAnalyzerCalSysErr fDropAnalyzer;
JButton fGoButton;
// Change these names as needed
String fButtonName1 = "Go";
// Filter and File object for fFile chooser
DataFilter fDataFilter = new DataFilter ();
File fInFile;
String fInFileName = "[select input file]";
// DataInputStream is used to read the data.
DataInputStream fInData;
// 2-D array to hold position and time data for
// each drop.
double [][] fData;
// The data file includes the time for when it
// was made.
Date dateOfData;
// Enumerated type used to direct output operations
public enum InputCmd {IN_SETUP, IN_READ, OUT_CLOSE}
// Enumerated type used to direct output operations
public enum InputStatus {OK, EVENT_READ, EOF,
ERROR}
InputStatus fInputStatus;
// Maximum number of measurements along each drop
trajectory
int fMaxNumMeasurements;
// Number of measurements on current drop
int fNumMeasures;
// Drop number in the file
int fNumDrops;
// Max number of drops in the file
int fMaxNumDrops;
// The following experimental settings could be
allowed
// to vary and then recorded in the data header
for a given
// run. However, this program assumes they are
constant.
// Starting coordinates of drop
double fXBallStart = 25.0; // cm
double fYBallStart = 200.0; // cm
double fYBallEnd = 0.0;
// cm
// Range of the drop time.
double fTStart = 0.00; // sec
double fTEnd = 0.75; // sec
/** Create a frame for displaying the GUI.**/
public static void main (String [] args) {
String title="Drop Data Analysis";
DropDataAnalysisCalSysErr f = new
DropDataAnalysisCalSysErr (title);
f.setVisible (true);
} // main
/**
* The GUI is built in the constructore.
Pass a title
* to the frame via the constructor argument.
**/
DropDataAnalysisCalSysErr (String title) {
super (title);
// Create a user interface.
setLayout (new BorderLayout ());
// Create an analyzer and add its
panel to the frame.
fDropAnalyzer = new DropAnalyzerCalSysErr
(
fYBallEnd,
fYBallStart,
fTStart,
fTEnd);
add (fDropAnalyzer.getPanel (), "Center");
// Create a panel with a textfield
and two buttons
fFileTextField = new JTextField (fInFileName);
fGoButton = new JButton (fButtonName1);
fGoButton.addActionListener (this);
fCalPosTextField = new JTextField
("0.0");
JPanel panel = new JPanel (new GridLayout
(1,3));
panel.add (fFileTextField);
panel.add (fCalPosTextField);
panel.add (fGoButton);
add (panel, "South");
// Use the helper method makeMenuItem
// for making the menu items and registering
// their listener.
JMenu m = new JMenu ("File");
// the particular program.
m.add (fMenuOpen = makeMenuItem
("Open"));
m.add (fMenuClose = makeMenuItem ("Quit"));
JMenuBar mb = new JMenuBar ();
mb.add (m);
setJMenuBar (mb);
setSize (550,400);
setDefaultCloseOperation (JFrame.DISPOSE_ON_CLOSE);
} // ctor
/**
* Process events from the frame menu
and the chooser.
**/
public void actionPerformed ( ActionEvent e )
{
boolean status = false;
String command = e.getActionCommand
();
if (command.equals (fButtonName1))
{
if (fInputStatus == InputStatus.OK)
analyzeData ();
else
JOptionPane.showMessageDialog
(
null,
"File
not ready", "File Read Error",
JOptionPane.ERROR_MESSAGE);
}
else if (command.equals ("Open"))
{
// Open a fFile
status = openFile ();
if (!status) {
JOptionPane.showMessageDialog
(
null,
"Error
opening fFile!", "File Open Error",
JOptionPane.ERROR_MESSAGE);
fInputStatus
= InputStatus.ERROR;
} else {
fInputStatus
= InputStatus.OK;
}
} else if (command.equals ("Quit"))
{
dispose ();
}
} // actionPerformed
/**
* This "helper method" makes a menu
item and then
* registers this object as a listener
to it.
**/
private JMenuItem makeMenuItem (String name) {
JMenuItem m = new JMenuItem ( name
);
m.addActionListener ( this );
return m;
}
/** Carry out the analysis of the data in the
chosen file. **/
void analyzeData () {
int evt = 0;
while (true) {
// Read an event
inputFromFile (InputCmd.IN_READ);
// and analyze it.
if (fInputStatus == InputStatus.EVENT_READ)
{
fDropAnalyzer.analyzeDrop
(fData[0], fData[1], fNumMeasures);
} else
if (fInputStatus == InputStatus.EOF)
{
// Analyze
the full run data now.
fDropAnalyzer.analyzeRun
();
break;
} else
if (fInputStatus == InputStatus.ERROR)
{
JOptionPane.showMessageDialog
(
null,
"Read
failure", "File Read Error",
JOptionPane.ERROR_MESSAGE);
break;
}
}
} // analyzeData
/**
* This method handles the
input from the data file.
* The ennumerated type
InputCmd indicates which
* operation: setup, writing
each drop data set, and
* stream closeing should
be executed.
**/
void inputFromFile (InputCmd input_cmd) {
switch (input_cmd) {
case IN_SETUP:
try {
//
Wrap the FileInputStream with a DataInputStream
FileInputStream
file_input = new FileInputStream (fInFile);
fInData
= new DataInputStream (file_input );
//
Read header
//
First get the type of the run data
fRunType
= fInData.readInt ();
//
Then get the time of the run (in millisecs since 1970)
long
data_time = fInData.readLong ();
//
And convert to a date object.
dateOfData
= new Date (data_time);
//
Then convert this date to a string with date and time
DateFormat
df =
DateFormat.getDateTimeInstance(DateFormat.SHORT,DateFormat.SHORT);
String
run_date = df.format(dateOfData);
String
plot_title = "";
if
((fRunType & RUN_RUNCAL) != 0)
plot_title
+= "Cal run,";
else
plot_title
= "Sim Data,";
if
((fRunType & RUN_ADDCAL) != 0) plot_title += "cal offset,";
if
((fRunType & RUN_SYSERR) != 0) plot_title += "sys error,"
;
fDropAnalyzer.fDrawPanel.setTitle
(plot_title + run_date);
//
Now get the other data in the header
fMaxNumDrops
= fInData.readInt ();
fMaxNumMeasurements
= fInData.readInt ();
//
Check the calibration constant input from the user
try
{
fCalPosConstant
= Double.parseDouble (fCalPosTextField.getText ());
}
catch
(NumberFormatException ex) {
System.out.println ("Bad input value");
fCalPosConstant = 0.0;
}
//
Tell the analyzer how the max number of drop events to
//
expect and the max number of measurements for a drop.
fDropAnalyzer.initRun
(fMaxNumDrops, fMaxNumMeasurements, fCalPosConstant);
//
Need an array to hold data for a single drop
fData
= new double[2][fMaxNumMeasurements];
}
catch (FileNotFoundException
fnfe) {
JOptionPane.showMessageDialog
(
null,
"Cannot
open file!", "File Open Failure",
JOptionPane.ERROR_MESSAGE);
fInputStatus
= InputStatus.ERROR;
}
catch (IOException
ioe) {
JOptionPane.showMessageDialog
(
null,
"I/O
failure", "File Read Error",
JOptionPane.ERROR_MESSAGE);
fInputStatus = InputStatus.ERROR;
}
break;
case IN_READ:
// Now read
the data and analze.
try {
fNumDrops
= fInData.readInt (); // drop number
fNumMeasures
= fInData.readInt (); // Number of measurements
//
Write the data as an position/time pair
for
(int i=0; i < fNumMeasures; i++) {
fData[0][i]
= fInData.readDouble (); // positions
fData[1][i]
= fInData.readDouble (); // times
}
fInputStatus
= InputStatus.EVENT_READ;
}
catch (EOFException
eof) {
fInputStatus
= InputStatus.EOF;
inputFromFile
(InputCmd.OUT_CLOSE);
}
catch (IOException
e) {
JOptionPane.showMessageDialog
(
null,
"I/O
failure", "File Read Error",
JOptionPane.ERROR_MESSAGE);
fInputStatus
= InputStatus.ERROR;
inputFromFile
(InputCmd.OUT_CLOSE);
}
break;
case OUT_CLOSE:
// Close file
when finished with it.
try {
fInData.close
();
}
catch (IOException
e) {
JOptionPane.showMessageDialog
(
null,
"I/O
failure on file close!", "File Read Error",
JOptionPane.ERROR_MESSAGE);
}
break;
}
} // inputFromFile
/**
* Use a JFileChooser in Open mode
to select fFiles
* to open. Use a filter for FileFilter
subclass to select
* for *.dat fFiles. If a file is selected
then read the
* file and place the string into the
textarea.
**/
boolean openFile () {
JFileChooser fc = new JFileChooser
();
fc.setDialogTitle ("Open File");
// Choose only fFiles, not directories
fc.setFileSelectionMode ( JFileChooser.FILES_ONLY);
// Start in current directory
fc.setCurrentDirectory (new File ("."));
// Set filter for web pages.
fc.setFileFilter (fDataFilter);
// Now open chooser
int result = fc.showOpenDialog (this);
if (result == JFileChooser.CANCEL_OPTION)
{
return true;
} else if ( result == JFileChooser.APPROVE_OPTION)
{
fInFile =
fc.getSelectedFile ();
String fInFileName
= fInFile.getName ();
if (fInFileName
!= null) {
fFileTextField.setText (fInFileName);
inputFromFile (InputCmd.IN_SETUP);
} else
return false;
} else {
return false;
}
return true;
} // openfFile
} // class DropDataAnalysis
/** Class to use with JFileChooser for selecting hypertext
fFiles.*/
class DataFilter extends javax.swing.filechooser.FileFilter
{
public boolean accept (File f) {
return f.getName ().toLowerCase ().endsWith
(".dat")
|| f.isDirectory
();
}
public String getDescription () {
return "Data files (*.data)";
}
} // class DataFilter |
|
import
java.awt.*;
import javax.swing.*;
/**
* This class carries out the analysis
of the drop experiment.
* It is similar to the DropAnalyzer
class but allows for subtraction
* of calibration constant from the
position data. It also displays
* the whole polynominal fit to the position
vs time curve.
**/
public class DropAnalyzerCalSysErr extends DropAnalyzer
{
// Allow for a calibration constant to be subtracted
// from the position data.
double fCalPosConstant = 0.0;
/**
* The constructor receives
the limits to the
* vertical range of the
drop and the times.
**/
public DropAnalyzerCalSysErr (double y_data_min,
double y_data_max,
double
t_data_min, double t_data_max) {
super (y_data_min, y_data_max, t_data_min,
t_data_max);
} // DropAnalyzerCalSysErr
/**
* Get the data measurements
from the detector for a
* single drop. The time
and positions are recorded from
* the first measurement
point. The arrays may not be full
* so the fNumMeasurements
variable keeps track of the number
* of elements with data.
* Subtract the calibration
constant from the position data.
**/
public void analyzeDrop (double [] measured_pos,
double [] measured_times,
int n_measures ){
// Restrict the number drops to
the fixed size of the data array.
if (fNumDrops >= fMaxNumDrops )
return;
// Use the given number of elements
in the array but don't exceed
// the size of the fDyData.
fNumMeasurements = n_measures;
if (fNumMeasurements > fMaxNumMeasurements)
fNumMeasurements
= fMaxNumMeasurements;
// Make sure that the buffer size
equals that of the time data array
if (fDtData == null || fDtData.length
< n_measures)
fDtData
= new double[fNumMeasurements];
for (int j=0; j < fNumMeasurements;
j++){
// Save
the time data. Assume it does not change
// significantly
from drop to drop.
fDtData[j]
= measured_times[j];
// Record
the position data for every drop so that
// we can
do averaging and error calculations at the
// end of
the run.
fDyData[fNumDrops][j]
= measured_pos[j] - fCalPosConstant;
}
fNumDrops++;
} // analyzeDrop
/**
* Analyze the data from
a set of drops.
* Find the average position
at each time step.
* Also calculate the
sigma on the position.
* Show the fitted polynominal
along with the
* error on the parameters
of the fit.
**/
public void analyzeRun () {
if (fNumDrops == 0) return;
// Create the arrays needed for
the averaging
// and std.dev. calculation.
double [] dyAvg = new
double[fNumMeasurements];
double [] dySq = new
double[fNumMeasurements];
double [] sigmaY = new double[fNumMeasurements];
// Accumulate the sums for the averaging
for (int i=0; i < fNumDrops; i++)
{
for (int j=0; j < fNumMeasurements;
j++){
dyAvg[j]
+= fDyData[i][j];
dySq[j] +=
fDyData[i][j] * fDyData[i][j];
}
}
// Get the average position and
its std.dev.
for (int j=0; j < fNumMeasurements;
j++){
// Get the average velocity
over the top gap
dyAvg[j] /= fNumDrops;
dySq[j] /=
fNumDrops;
// Calculate the std.dev.
double err = dySq[j]
- dyAvg[j]*dyAvg[j];
// Roundoff might result
in a neg value for case of
// very small
or zero smearing of the position data.
if ( err < 1.0E-10)
sigmaY[j]=0.0;
else
sigmaY[j]
= Math.sqrt (err);
}
fPointsData[0] = dyAvg;
fPointsData[1] = fDtData;
fPointsData[2] = sigmaY;
fPointsData[3] = null; //
assume no error on the time values
// Pass the data points info to
the fDrawPoints object
fDrawPoints.setParameters ( null,
fPointsData);
// Fit points to a quadratic. Make
parameters array twice as big
// to make room for error values.
double [] parameters = new double[6];
FitPoly.fit (parameters, fDtData,
dyAvg, null, sigmaY, fNumMeasurements);
// Pass the fitted parameters to
the DrawPoly object to draw the
// quadratic.
fDrawPoly.setParameters (parameters,
null);
// Use the PlotFormat static method
to format the parameters from the fit
// to the data. (FitPoly
uses the covariance matrix diagonal elements
// to estimate the parameter errors.)
double y0 = parameters[0];
double y0_err = parameters[3];
double v0 = parameters[1];
double v0_err = parameters[4];
double g = parameters[2]*2.0;
double g_err = parameters[5]*2.0;
String fit_result =
"y0 = " +
PlotFormat.getFormatted
(y0,1100.0,0.0,3) + "+/-" +
PlotFormat.getFormatted
(y0_err,1100.0,0.0,3) + "cm"
+ ", v0 = " +
PlotFormat.getFormatted
(v0,1100.0,0.0,4) + "+/-" +
PlotFormat.getFormatted
(v0_err,1100.0,0.0,3) + "cm/s"
+ ", g = " +
PlotFormat.getFormatted
(g,1100.0,0.0,4) + "+/-" +
PlotFormat.getFormatted
(g_err,1100.0,0.0,3) + "cm/s^2";
fResultsField.setText (fit_result);
// Cause the curve to
be redrawn.
fDrawPanel.repaint ();
} // analyzeRun
/**
* Before each experiment (i.e.
set of drops), indicate here the number
* of measurements per
drop and the maximum number of drops per run.
**/
public void initRun (int max_drops, int max_num_measurements,
double cal_pos) {
fMaxNumMeasurements = max_num_measurements;
fNumMeasurements = max_num_measurements;
fMaxNumDrops = max_drops;
fCalPosConstant = cal_pos;
// Create the data buffers.
if (fDyData == null || fDyData.length
< fMaxNumDrops)
fDyData = new double[fMaxNumDrops][fMaxNumMeasurements];
reset ();
} // initRun
} // DropAnalyzerCalSysErr
|
Most recent update: Nov. 8, 2005
|
